Big Data
Things to Keep in Mind When Choosing a Cloud Services Solution
Picking the right cloud services solution is critical to ensuring long-term success. Click to know about how you can choose the right one for your business.
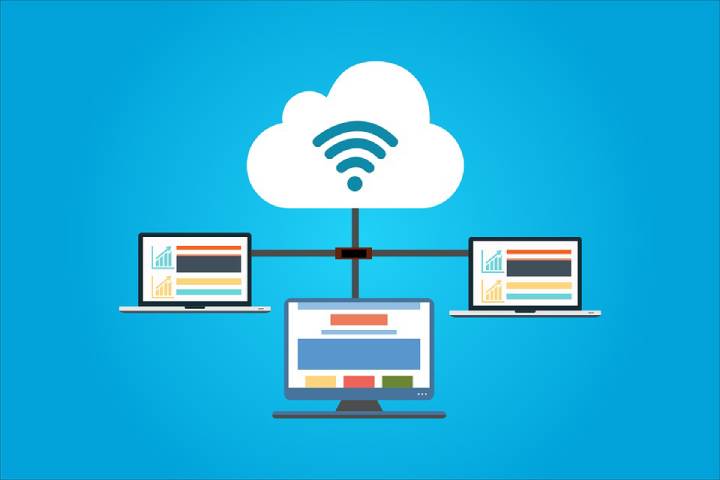
The market for cloud services solutions is ever-expanding. With more and more businesses switching to cloud hosting and sharing platforms, now is the time to make the switch from the analog to digital way of trade. The Australian Bureau of Statistics reports that 42% of businesses in the country used some form of cloud computing facilities in 2017-’18, suggesting a sharp increase from 31% in 2015-’16.
Cisco studies predict that 94% of the workload will be taken care of by cloud computing systems, come 2021. With so many opportunities and services, the cloud solutions market is expected to reach $623.3 billion worldwide by 2023, as per Report Linker statistics.
Market giants like Google, Amazon, and Microsoft rule the roost when it comes to cloud computing. But there is more to it than just buying one that’s most popular. Sometimes, smaller cloud computing systems can offer customized services that strike a chord with your trade. But if you stick to the widely-known ones, you may end up losing the opportunity of streamlining your business even further.
This post aims to help you see two of the most crucial factors when it comes to cloud computing: knowing when to pick and knowing what to pick. Read on to gain a better understanding of which cloud services solution is most suited to your specific business needs.
Table of Contents
Pick the right time to choose a cloud services solution
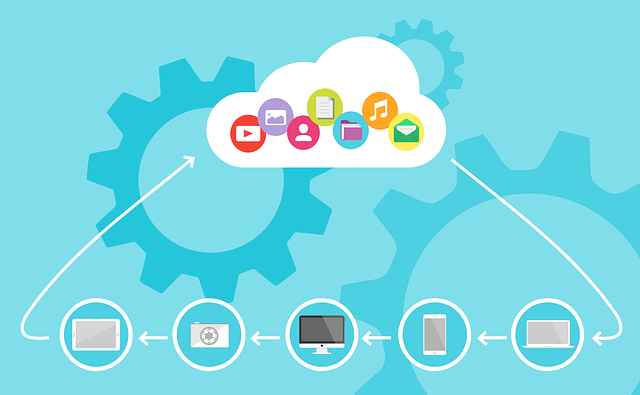
Remember, you must not jump the cloud service bandwagon simply because everyone else is doing so. Instead of going with the flow, it is best to assess your business needs at first. You should do this BEFORE you set out to pick a cloud computing service for your business.
Here are a few things you must consider when assessing your business requirements with regard to the kind of cloud computing services you need.
- Create a checklist of all the indispensable cloud requirements of your business.
- Learn more about the technical, data governance, security, and service management needs for your business.
- You should also consider things like chunking up workloads and migrating existing workloads into the new cloud computing framework.
Begin looking for a suitable cloud services solution only after you have a clear idea about all the business needs. Go through the rest of this post to determine the kind of cloud computing solutions that correspond with the business needs you list out at this stage.
Some business use normal cloud based virtual PCs and some of them use a advanced citrix virtual desktop for their IT infrastructure depending upon their needs.
Questions you should ask when picking a cloud services solution

Aligning business objectives
- Simply stating your business objectives is not enough. How important are the outcomes that affect the success of your business?
- Sarah Redland, an assignment help expert, remarks, “What are the resources that you are willing to allocate to achieve your business objectives when it comes to cloud computing services?”
- Can you rank the business objectives according to priorities? Can you align the cloud service providers with the rankings?
Knowing service level agreements (SLAs)
Figuring in security issues
- Are the components in the cloud infrastructure single-tenant or multi-tenant in nature?
- What type of network segmentation will you get with your cloud service solutions? And which are the ones you really need?
- What happens to data security in-flight and at rest? It is the backbone of your business, after all. So, make sure you test the waters before taking a plunge.
Looking for cloud automation factors
- Automation has a role in almost every business operation nowadays. But which are the areas that you would like to automate the most?
- What happens to exposed application programming interfaces (API) during the move to automation? Do you have in-house minds to handle this, or do you need to hire outside help for the same?
- Make sure you have a list of all apps that you need to make the move. Choose the right orchestration platforms for the apps. Will you need to rewrite some of applications to make them automation-ready?
Factoring in business continuity
- Since cloud service providers are not always on the same page when it comes to business continuity, you must figure in your stance. What stance will the cloud solution provider offer?
- Disaster recovery comes hand in hand with business continuity. What kinds of DRs does the cloud solution provider offer?
- What are the recovery point objectives when it comes to continuity and disasters?
Identifying risk management and compliance
- What kind of governance stance fits your bill the most within a cloud service solution?
- How would you assess the risk management factors within the new framework?
- What are the requirements for compliance from the business point of view, as well as the client’s perspective?
- How is ownership defined in the cloud computing services? Who is the technical and legal owner of the infrastructure?
- Are there controls in place within the framework that lets you maintain compliance?
Keeping your business migration-ready
- Assess how ready your business currently is for the migration stage. Have you performed a cloud-readiness survey?
- What are the interdependent factors within your business that you need to identify for the migration? Have you chalked out the day-to-day operations through cloud computing with your IT team?
- Now comes the time to know more about the migration itself. Migration is one of the complex task which is needed to be performed with care whether it is an data migration or an Office 365 migration. Do you have to do it by yourself, or will the solution provider share the task with you?
Keeping leeway for service termination
- Keep in mind that you will not be sticking to the same cloud computing software forever. Do you understand the service termination conditions?
- What works best for your business when terminating the service – an email, a call or a written notice? Look for the fine print too.
- When will the billing cease after you have terminated the services? Make sure you understand the billing cycle.
- Coming to data security now. What happens to your data after the termination? Does it just go away, or does the company have the right to use it as it pleases?
Pricing matters and why they matter
- Finally comes the matter of prices. See if you need to pay any upfront capital expenditures. Does the bill go under operational expenses?
- Get a better understanding of the billing model. How is it calculated, and what are the increments?
- Calculate your costs carefully. What is the bottom line for migration, utilization and preparation?
Parting words
Each business has a unique set of requirements and evaluation tactics when it comes to picking a cloud service provider. If you ask yourself the questions discussed in this post for each section of the selection process, the answers are sure to point you in the right direction. From certifications to contracts, make sure you have considered each factor carefully before zeroing in on cloud services solutions for your business. Make an informed decision. Godspeed!
Helpful Resources:
1. Impact of Artificial Intelligence (AI) on Software Development Industry in [2019]
2. Do Human Translators Have a Reason to Be Afraid of Advancing Technologies
3. Artificial Intelligence And Its Demands To The Programmers
4. Artificial intelligence (AI): Friend or Foe to Future Designers?
5. Top 20 Working 13377x Proxy List in [2019]
6. Top 10 Artificial Intelligence (AI) App Development Trends in [2019]
Big Data
How To Use Histogram Charts for Business Data Visualization
One such tool for data visualization that stands out for its simplicity and effectiveness is the histogram. Keep reading to learn more about histogram charts.

Data visualization is an indispensable tool for businesses operating in the contemporary digital era. It enhances the understanding and interpretation of complex data sets, paving the way for informed decision-making. One such tool for data visualization that stands out for its simplicity and effectiveness is the histogram. Keep reading to learn more about histogram charts.
Table of Contents
1. Understanding the Basics of Business Data Visualization
Alt text: A person looking at different data visualizations on a computer before looking at a histogram chart.
Business data visualization is a multidisciplinary field merging statistical analysis and computer science fundamentals to represent complex data sets visually. It transforms raw data into visual information, making it more understandable, actionable, and useful.
Visualization tools such as histogram charts, pie charts, bar graphs, and scatter plots offer businesses a way to understand data trends, patterns, and outliers—essentially bringing data to life.
Whether you’re analyzing sales performance, forecasting market trends, or tracking key business metrics, data visualization can be a powerful tool for presenting data that might otherwise be overlooked.
2. Deciphering the Role of Histogram Charts in Data Analysis
Histogram charts are a superb tool for understanding the distribution and frequency of data. They are bar graphs where each bar represents a range of data values known as a bin or bucket. The height of each bar illustrates the number of data points that fall within each bucket.
Unlike bar graphs that compare different categories, histogram charts visually represent data distribution over a continuous interval or a particular time frame. This makes them invaluable for many business applications, including market research, financial analysis, and quality control.
By portraying large amounts of data and the frequency of data values, histogram charts provide an overview of data distribution that can aid in predicting future data trends. It helps businesses to spot patterns and anomalies that might go unnoticed in tabular data.
3. Key Steps To Create Effective Histogram Charts
Creating effective histogram charts involves steps, starting with data collection. You need to gather relevant and accurate data for the phenomenon you’re studying.

Next, you determine the bins and their intervals. Bins are data ranges, and their number depends on the level of detail you want from your histogram. It’s essential to keep bins equal in size to facilitate comparison.
Once you’ve structured your data and decided on the number of bins, the next step is to count how many data points fall into each bin. This is the basis of your histogram.
Finally, you draw the histogram with the bins on the x-axis and the frequency on the y-axis. Each bin is represented by a bar, the height of which represents the number of data points that fall into that bin.
4. Advantages of Using Histogram Charts for Business Data Visualization
Alt text: A person on a computer looking at multiple screens with histogram charts.
Histograms offer a host of advantages in the realm of business data visualization. They provide a clear, visual summary of large data sets, making it easier to digest and comprehend the data.
Histograms are also useful in identifying outliers or anomalies in data, which can be significant in industries such as finance and quality control, where an anomaly could signify a significant issue that needs to be addressed.
5. Real-world examples of Business Data Visualization Using Histogram Charts
Many businesses use histograms to visualize data. For instance, a retail company may use histograms to analyze customer purchase patterns, enabling them to identify peak shopping times, seasonality, and trends in customer preferences.
A manufacturing company might use histogram charts to monitor product quality. By analyzing the frequency of defects, they can identify the cause of the problem and take corrective actions faster.
Histograms are also widely used in the financial industry. Financial analysts use histogram charts to visualize the distribution of investment returns, helping them to understand the risk associated with an investment.
Histogram charts are crucial in business data visualization, offering clear and concise representations of large data sets.
-

 Instagram4 years ago
Buy IG likes and buy organic Instagram followers: where to buy them and how?
-

 Instagram4 years ago
100% Genuine Instagram Followers & Likes with Guaranteed Tool
-

 Business5 years ago
7 Must Have Digital Marketing Tools For Your Small Businesses
-

 Instagram4 years ago
Instagram Followers And Likes – Online Social Media Platform

