Big Data
How To Use Histogram Charts for Business Data Visualization
One such tool for data visualization that stands out for its simplicity and effectiveness is the histogram. Keep reading to learn more about histogram charts.

Data visualization is an indispensable tool for businesses operating in the contemporary digital era. It enhances the understanding and interpretation of complex data sets, paving the way for informed decision-making. One such tool for data visualization that stands out for its simplicity and effectiveness is the histogram. Keep reading to learn more about histogram charts.
Table of Contents
1. Understanding the Basics of Business Data Visualization
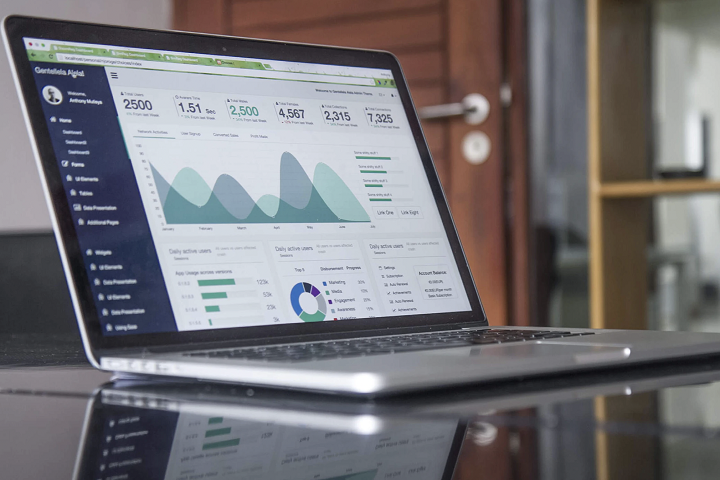
Alt text: A person looking at different data visualizations on a computer before looking at a histogram chart.
Business data visualization is a multidisciplinary field merging statistical analysis and computer science fundamentals to represent complex data sets visually. It transforms raw data into visual information, making it more understandable, actionable, and useful.
Visualization tools such as histogram charts, pie charts, bar graphs, and scatter plots offer businesses a way to understand data trends, patterns, and outliers—essentially bringing data to life.
Whether you’re analyzing sales performance, forecasting market trends, or tracking key business metrics, data visualization can be a powerful tool for presenting data that might otherwise be overlooked.
2. Deciphering the Role of Histogram Charts in Data Analysis
Histogram charts are a superb tool for understanding the distribution and frequency of data. They are bar graphs where each bar represents a range of data values known as a bin or bucket. The height of each bar illustrates the number of data points that fall within each bucket.
Unlike bar graphs that compare different categories, histogram charts visually represent data distribution over a continuous interval or a particular time frame. This makes them invaluable for many business applications, including market research, financial analysis, and quality control.
By portraying large amounts of data and the frequency of data values, histogram charts provide an overview of data distribution that can aid in predicting future data trends. It helps businesses to spot patterns and anomalies that might go unnoticed in tabular data.
3. Key Steps To Create Effective Histogram Charts
Creating effective histogram charts involves steps, starting with data collection. You need to gather relevant and accurate data for the phenomenon you’re studying.
Next, you determine the bins and their intervals. Bins are data ranges, and their number depends on the level of detail you want from your histogram. It’s essential to keep bins equal in size to facilitate comparison.
Once you’ve structured your data and decided on the number of bins, the next step is to count how many data points fall into each bin. This is the basis of your histogram.
Finally, you draw the histogram with the bins on the x-axis and the frequency on the y-axis. Each bin is represented by a bar, the height of which represents the number of data points that fall into that bin.
4. Advantages of Using Histogram Charts for Business Data Visualization
Alt text: A person on a computer looking at multiple screens with histogram charts.
Histograms offer a host of advantages in the realm of business data visualization. They provide a clear, visual summary of large data sets, making it easier to digest and comprehend the data.
Histograms are also useful in identifying outliers or anomalies in data, which can be significant in industries such as finance and quality control, where an anomaly could signify a significant issue that needs to be addressed.
5. Real-world examples of Business Data Visualization Using Histogram Charts
Many businesses use histograms to visualize data. For instance, a retail company may use histograms to analyze customer purchase patterns, enabling them to identify peak shopping times, seasonality, and trends in customer preferences.
A manufacturing company might use histogram charts to monitor product quality. By analyzing the frequency of defects, they can identify the cause of the problem and take corrective actions faster.
Histograms are also widely used in the financial industry. Financial analysts use histogram charts to visualize the distribution of investment returns, helping them to understand the risk associated with an investment.
Histogram charts are crucial in business data visualization, offering clear and concise representations of large data sets.
How AI Is Reshaping Digital Marketing Strategies in 2026

Maximizing ROI with HCI: Real‑World Benefits for IT Leaders

Search Atlas: What the Platform Does and Why It Leads in Local SEO
How Alert Fatigue Is Increasing Cyber Risk

How Apps Can Make Employee Communication A Lot More Simple

The Global Awakening: Understanding Gen Z’s Voice 🌍🎤

Canva AI: Your Creative Co-Pilot, Explained 🎨🤖

DALL·E AI: Redefining Creativity with Artificial Intelligence 🎨🤖

Runway ML: The Future of AI-Powered Creativity 🎥✨

🎨 Midjourney: The Complete Guide to AI Art Generation in 2025

Buy IG likes and buy organic Instagram followers: where to buy them and how?

100% Genuine Instagram Followers & Likes with Guaranteed Tool

7 Must Have Digital Marketing Tools For Your Small Businesses

Instagram Followers And Likes – Online Social Media Platform

Use of 3D Printing in Injection Molding

Top 25 Best SolarMovie Alternatives Updated List

13377x Original Site: 1337x Official Site, Proxy Sites, Movies, Torrents

Principles of Good Software Engineering

How To Get Started With Artificial Intelligence

Tamilrockers Alternatives: TamilRockers Proxy and Mirror Sites [working]
-
Instagram5 years ago
Buy IG likes and buy organic Instagram followers: where to buy them and how?
-
Instagram5 years ago
100% Genuine Instagram Followers & Likes with Guaranteed Tool
-
Business7 years ago
7 Must Have Digital Marketing Tools For Your Small Businesses
-
Instagram6 years ago
Instagram Followers And Likes – Online Social Media Platform