Computer Network
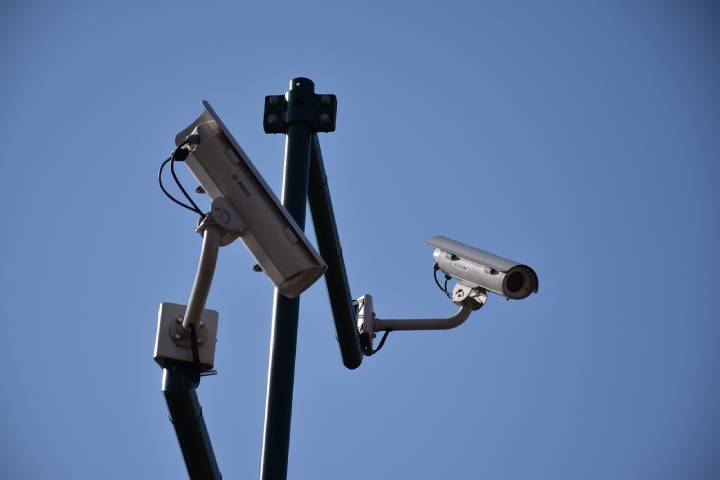
6 Reasons You Should Have Security Cameras at Your Business
Implementing security cameras in business can Protecting your assets, ensure employee accountability, and provide evidence in legal matters
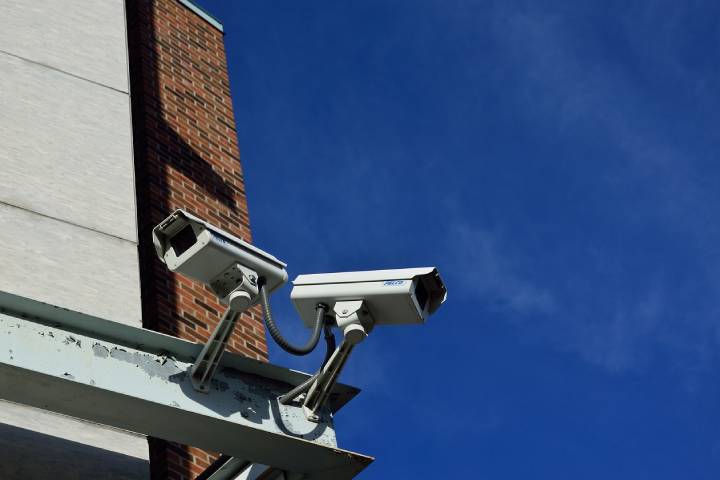
Today, more and more businesses are realizing the importance and value of video surveillance systems. Threats from both external and internal sources can be a constant worry for business owners, and peace of mind is scarce.
Having a robust video monitoring system like the one offered by Genetec will help you capture, store, and analyze video footage of everything that goes down on your premises. How will this help you in protecting what matters to you? Let’s find out.
Table of Contents
1. Deterring Crime
First of all, video cameras are a natural deterrent for teenage scallywags and serious criminals alike.
If you have cameras visible on your property, anyone with ill intentions will understand that their risk of being caught out is that much higher, and they’ll naturally reconsider their actions.
In this sense, you may never need to use your video cameras for checking out any actual footage – if this is the case, you’ll know that they’ve done their job of preventing any incidents from happening in the first place.
2. Protecting Your Assets
Of course, as a business owner, there are things that are important to you. Whether it’s the property itself, equipment, inventory, or any other valuable assets, it’s important that you have an extra layer of security protecting them – especially if they might make your business a specific target.
Video surveillance is a much more practical and affordable option than having someone physically monitoring your assets 24/7.
3. Keeping Your Employees Accountable
Unfortunately, internal threats are a real thing, and many business owners have suffered at the hands of an “inside job.”
Data theft, physical theft, fraud, and other crimes have seriously impacted a large percentage of businesses, and small businesses are especially at risk.
Having surveillance cameras can help deter any issues of this nature and will further hold your employees accountable to do their jobs and maintain productivity levels.
4. Security Cameras in Business Reduced Insurance Costs
Business owners need to be constantly on the lookout for ways to reduce their costs and increase profit margins. One such way is to ensure you’re keeping your insurance premiums as low as possible – and having a great security system can help you do that.
The better protected your business is, the lower the risk is for incidents, and the less you’ll be charged for your insurance policy.
5. Evidence in Legal Matters
Many businesses will have to face a dispute at some point – between employees, between an employer and an employee, or even between employees and customers. In many cases, a lack of real evidence can make things complicated and even unjust.
Having security footage of your premises can provide important evidence for any disputes or legal matters that might arise, helping you to ensure that things are resolved efficiently and fairly.
6. Peace of Mind
Finally, remember that having peace of mind about the safety of your business, your assets, and your staff is priceless.
Video surveillance offers an extra layer of protection and security that will help you sleep easier at night, knowing that what matters to you is under protection and less at risk.
How AI Is Reshaping Digital Marketing Strategies in 2026

Maximizing ROI with HCI: Real‑World Benefits for IT Leaders

Search Atlas: What the Platform Does and Why It Leads in Local SEO
How Alert Fatigue Is Increasing Cyber Risk

How Apps Can Make Employee Communication A Lot More Simple

The Global Awakening: Understanding Gen Z’s Voice 🌍🎤

Canva AI: Your Creative Co-Pilot, Explained 🎨🤖

DALL·E AI: Redefining Creativity with Artificial Intelligence 🎨🤖

Runway ML: The Future of AI-Powered Creativity 🎥✨

🎨 Midjourney: The Complete Guide to AI Art Generation in 2025

Buy IG likes and buy organic Instagram followers: where to buy them and how?

100% Genuine Instagram Followers & Likes with Guaranteed Tool

7 Must Have Digital Marketing Tools For Your Small Businesses

Instagram Followers And Likes – Online Social Media Platform

Use of 3D Printing in Injection Molding

Top 25 Best SolarMovie Alternatives Updated List

13377x Original Site: 1337x Official Site, Proxy Sites, Movies, Torrents

Principles of Good Software Engineering

How To Get Started With Artificial Intelligence

Tamilrockers Alternatives: TamilRockers Proxy and Mirror Sites [working]
-
Instagram5 years ago
Buy IG likes and buy organic Instagram followers: where to buy them and how?
-
Instagram5 years ago
100% Genuine Instagram Followers & Likes with Guaranteed Tool
-
Business7 years ago
7 Must Have Digital Marketing Tools For Your Small Businesses
-
Instagram6 years ago
Instagram Followers And Likes – Online Social Media Platform