Database
NoSQL Database by MongoDB: Alternatives and Similar Services
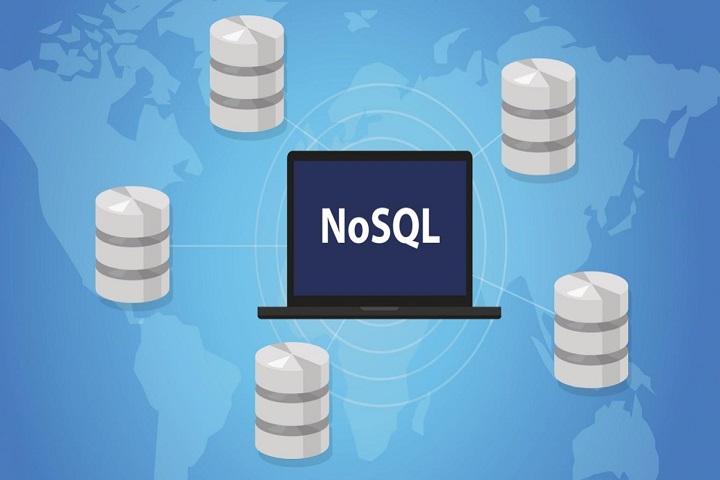
NoSQL Database Alternatives to MongoDB. Here are the top alternative options if you don’t want MongoDB or know more about your NoSQL options.
The NoSQL database by MongoDB offers a document-oriented system. The database is one of the best-known options for NoSQL, but several alternatives and similar services provide excellent opportunities for developers.
NoSQL Database Alternatives to MongoDB
Here are the top alternative options if you don’t want MongoDB or know more about your NoSQL options.
Table of Contents
1. BangDB
BangDB is a multi-model NoSQL database, meaning you can store all types of data within it and not just documents like on MongoDB. It’s capable of some heavy lifting with complex applications.
BangDB boasts some of the best performance available on the market today. It supports complete ACID to serve as a transactional database. Native AI powers machine learning so you can predict events. Stream processing makes it simple to act on those events as they happen.
2. Redis
Redis is an open-source NoSQL database. Its distributed architectures of using geographically distributed Active-Active and Active-Passive helps provide high availability.
It offers built-in search capabilities and supports a comprehensive set of data structures. Just know that Redis is one of the more expensive options on the market, and some users report a time-consuming process for logging in to execute commands.
3. Cassandra
Cassandra is an open-source NoSQL database. Facebook completed the initial development for the database. It offers high availability and scalability. It supports replication across multiple data centers or cloud servers. The data replication in numerous nodes aids in creating a fault-tolerant system.
Every node can work independently, making this an accessible database to use in a distributed format. This database is ideal for enterprises and large data sets.

4. DynamoDB
Amazon’s NoSQL database is DynamoDB. The serverless database is a key-value system and scales well without losing performance. You’ll get security, backup and restore services, and in-memory caching with DynamoDB.
Astoundingly, it can handle up to 10 trillion requests if you’re building large applications that require high traffic or use cases with prominent peaks. Just remember that you understand what you pay for here as it’s an expensive NoSQL database designed for large applications. You’ll also face some severe learning curves with using DynamoDB.
5. OrientDB
OrientDB is another open-source alternative to MongoDB. If one of the things you like about MongoDB is that it is a graph database, you’ll enjoy working with OrientDB because it uses a True Graph Engine. But it can handle a variety of data types and not just graphs.
However, unlike MongoDB, you can build complex relationships between your data. Plus, you’ll get free clustering support. Watch out for compatibility issues if you select OrientDB.
6. ArangoDB
This is an open-source database with excellent availability and firm performance. ArangoDB is a multi-model graph database with data flexibility. It offers the freedom to use SQL-like query language so that the system will feel familiar if your team has done little in NoSQL up to this point.
The search engine within it is robust, and you’ll find good support for graph analytics queries.
7. CouchDB
CouchDB stores all data in JSON format. It is an open-source document-oriented database. It supports distributed applications with high data volumes well. It’s incredibly well designed for handling large amounts of data with very little structure.
The database is free, but you might see its lack of funding in the somewhat confusing and clunky user interface. It’s best used when you have large amounts of lightly structured data.
8. RethinkDB
RethinkDB is an open-source database that stores JSON documents. It works well for use cases where you need to store data across multiple data centers or machines. Another strength that this database has is in real-time applications. Just be aware that this database is no longer receiving updates since it shut down in 2016.
Summary
While MongoDB might be the NoSQL database that you’ve heard the most about, that doesn’t necessarily mean that it is the best one for your application. Research a few alternatives before selecting your database.
How AI Is Reshaping Digital Marketing Strategies in 2026

Maximizing ROI with HCI: Real‑World Benefits for IT Leaders

Search Atlas: What the Platform Does and Why It Leads in Local SEO
How Alert Fatigue Is Increasing Cyber Risk

How Apps Can Make Employee Communication A Lot More Simple

The Global Awakening: Understanding Gen Z’s Voice 🌍🎤

Canva AI: Your Creative Co-Pilot, Explained 🎨🤖

DALL·E AI: Redefining Creativity with Artificial Intelligence 🎨🤖

Runway ML: The Future of AI-Powered Creativity 🎥✨

🎨 Midjourney: The Complete Guide to AI Art Generation in 2025

Buy IG likes and buy organic Instagram followers: where to buy them and how?

100% Genuine Instagram Followers & Likes with Guaranteed Tool

7 Must Have Digital Marketing Tools For Your Small Businesses

Instagram Followers And Likes – Online Social Media Platform

Use of 3D Printing in Injection Molding

Top 25 Best SolarMovie Alternatives Updated List

13377x Original Site: 1337x Official Site, Proxy Sites, Movies, Torrents

Principles of Good Software Engineering

How To Get Started With Artificial Intelligence

Tamilrockers Alternatives: TamilRockers Proxy and Mirror Sites [working]
-
Instagram5 years ago
Buy IG likes and buy organic Instagram followers: where to buy them and how?
-
Instagram5 years ago
100% Genuine Instagram Followers & Likes with Guaranteed Tool
-
Business7 years ago
7 Must Have Digital Marketing Tools For Your Small Businesses
-
Instagram6 years ago
Instagram Followers And Likes – Online Social Media Platform