Computer
Why Transistors Are So Important to Circuitry
Why Transistors Are So Important to Circuitry. They Make Good Switches, They Can Amplify, Made Super Small, They’re Tough & Super-Efficient
It’s no hyperbole to say that many of the accelerated advancements in human technology can be attributed to the invention of the humble transistor. After being created in the 1940s, transistors paved the way for technology to become more compact, lightweight, and easy to use, thanks to its remarkable toughness, small size, and power consumption.
In the modern-day, transistors are an essential component for virtually every device of notoriety, such as home computers, digital cameras, and mobiles. The reason that transistors have become so widespread and useful in electronics is that it has a wide array of different uses and benefits. Here are some of them.
Table of Contents
1. They Make Good Switches
Transistors are used regularly to perform as switches due to their ability to turn currents on and off a billion times per second. It’s this insane speed and precision that allows digital computers to use this technology to save and store computer data, making it a truly vital piece of computing.
Its ability to turn currents on and off also means that humanity has a more simplified control over their electrical goods. The majority of people may take the ability to switch gadgets off for granted. Still, it means that we can operate machinery in a much safer manner and use it only when we need to, allowing us to stay energy efficient.

2. They Can Amplify
When correctly set-up and integrated into a circuit in a certain way, transistors can be used to amplify currents and even sound. It’s for this reason that the vast majority of audio and alternative signal amplifiers use transistors to perform this function, which in turn gives us better control over our devices and how we use them.
3. They Can Be Made Super Small
This is perhaps the biggest reason why transistors, and their various types, such as various types such as jfets, are so consequential.
With the ability to be made into the size as minuscule as a billionth of a meter, these little transistors can be packed into even the smallest of circuit boards and electronics, meaning they can be used in devices such as mobile phones and other tiny handheld devices.
The less space these components have to take up allows for more critical details to be attached to the device, such as more great cameras, larger batteries, or better screens, which improves the overall quality of the device drastically.
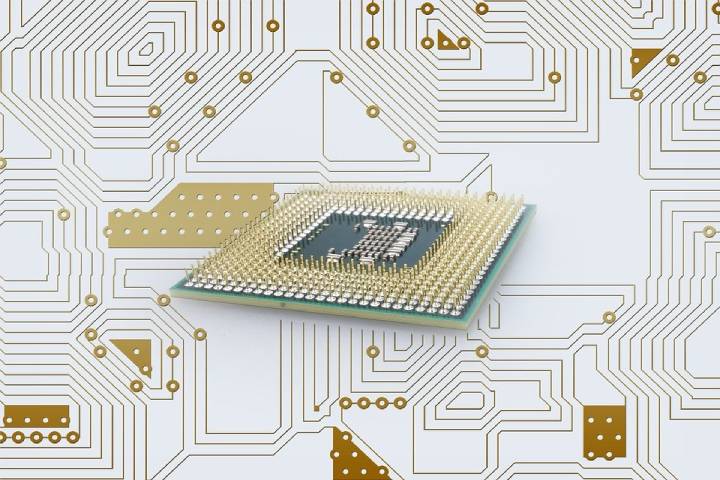
These tiny transistors are usually packed onto a silicon chip, and that’s how they become integrated into the circuitry.

4. They’re Tough
Transistors are challenging to break, making them extremely useful for durable items. They have sharp shock and impact absorption, meaning they can withstand extreme stress.
They also handle vibrations well, making them a piece of equipment that is often used for military, space, and industrial applications.
5. They’re Super-Efficient | Transistors Circuitry
Over the years, people have been able to create transistors that are designed in such a way to use extremely little power while still providing their primary function well.
This means that even a million of these transistors found inside a watch or calculator can be powered continuously without failure for multiple years.
How AI Is Reshaping Digital Marketing Strategies in 2026

Maximizing ROI with HCI: Real‑World Benefits for IT Leaders

Search Atlas: What the Platform Does and Why It Leads in Local SEO
How Alert Fatigue Is Increasing Cyber Risk

How Apps Can Make Employee Communication A Lot More Simple

The Global Awakening: Understanding Gen Z’s Voice 🌍🎤

Canva AI: Your Creative Co-Pilot, Explained 🎨🤖

DALL·E AI: Redefining Creativity with Artificial Intelligence 🎨🤖

Runway ML: The Future of AI-Powered Creativity 🎥✨

🎨 Midjourney: The Complete Guide to AI Art Generation in 2025

Buy IG likes and buy organic Instagram followers: where to buy them and how?

100% Genuine Instagram Followers & Likes with Guaranteed Tool

7 Must Have Digital Marketing Tools For Your Small Businesses

Instagram Followers And Likes – Online Social Media Platform

Use of 3D Printing in Injection Molding

Top 25 Best SolarMovie Alternatives Updated List

13377x Original Site: 1337x Official Site, Proxy Sites, Movies, Torrents

Principles of Good Software Engineering

How To Get Started With Artificial Intelligence

Tamilrockers Alternatives: TamilRockers Proxy and Mirror Sites [working]
-
Instagram5 years ago
Buy IG likes and buy organic Instagram followers: where to buy them and how?
-
Instagram5 years ago
100% Genuine Instagram Followers & Likes with Guaranteed Tool
-
Business7 years ago
7 Must Have Digital Marketing Tools For Your Small Businesses
-
Instagram6 years ago
Instagram Followers And Likes – Online Social Media Platform